This feature by Ioannis Valasakis was first published on Medical Imaging News of November 2021.
This reviews the preprint of “Anomaly detection in medical imaging with deep perceptual autoencoders” by Nina Shvetsova et al.🎉It has already 15 citations and you can easily find it on Arxiv, to read it in full.
Anomaly Detection
Anomaly detection is a task with significance, especially in the deployment of machine learning models. The knowledge of a “a normal” data sample would be used to compare -in a sense of a ground truth- to an “abnormal” one. To identify less often occurrences is another application where anomaly detection is useful and with the method proposed in this paper, the efficacy of autoencoders for anomaly detection is utilized.
The authors compared here the three strongest SOTA anomaly detection methods in two challenging medical tasks: Chest X-rays and H&E-stained histological images. In the manner of open science (Richard Stallman would call the free, oh well!), the source code of all our experiments to facilitate the development of anomaly detection in medical imaging is shared online. The solution was sequentially compared with both datasets with SOTA methods which were outperformed.
Even though Computer Vision News and Medical Imaging News focus on computer vision and medical learning, there is a wide range of fields where anomaly detection has been extensively studied. Domains including fraud detection, cyber-intrusion detection, as well anomalies in videos and financial analytics are some of the latest fields where research is active. Distribution based methods try to predict if the new example lies in the high-probability area or not.
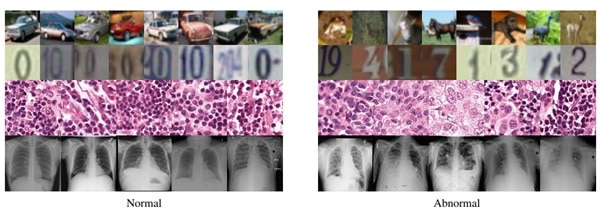
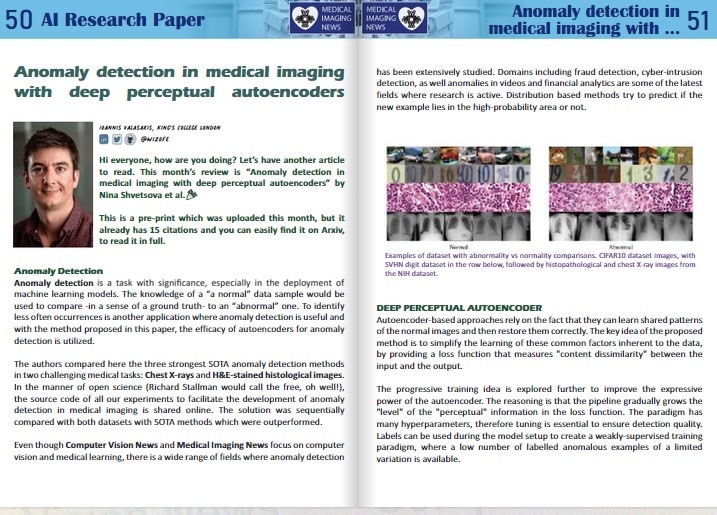
Examples of dataset with abnormality vs normality comparisons. CIFAR10 dataset images, with SVHN digit dataset in the row below, followed by histopathological and chest X-ray images from the NIH dataset.
DEEP PERCEPTUAL AUTOENCODER
Autoencoder-based approaches rely on the fact that they can learn shared patterns of the normal images and then restore them correctly. The key idea of the proposed method is to simplify the learning of these common factors inherent to the data, by providing a loss function that measures “content dissimilarity” between the input and the output.
The progressive training idea is explored further to improve the expressive power of the autoencoder. The reasoning is that the pipeline gradually grows the “level” of the “perceptual” information in the loss function. The paradigm has many hyperparameters, therefore tuning is essential to ensure detection quality. Labels can be used during the model setup to create a weakly-supervised training paradigm, where a low number of labelled anomalous examples of a limited variation is available.
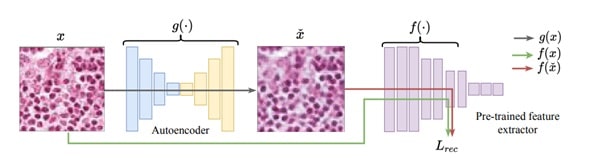
The autoencoder architecture for image anomaly detection, where g is the network, f the feature extractor, x^ the reconstructed image while the reconstruction L calculates the difference between f (x) and f (x^)
SOTA baselines were used for the evaluation in the problem statement of novelty detection and the training data were taken as “anomaly free” to examine two challenging medical problems with different image characteristics and appearance of abnormalities: metastases detection in digital pathology and chest X-Rays.
The task is to detect metastases in H&E stained images of lymph nodes in the Camelyon16 challenge by training anomaly detection models only on healthy tissue aiming to identify tissue with metastases. Tissues exhibiting metastasis may differ from healthy types only by texture, spatial structure, or distribution of nuclei.
Chest X-ray is one of the most common examinations for diagnosing various lung diseases and the task was to recognize 14 findings, such as Atelectasis or Cardiomegaly, on the chest X-rays in the NIH dataset (ChestX-ray14 dataset). To create the training dataset, the existing one was split into two parts with only posteroanterior (PA) or anteroposterior (AP) projections.
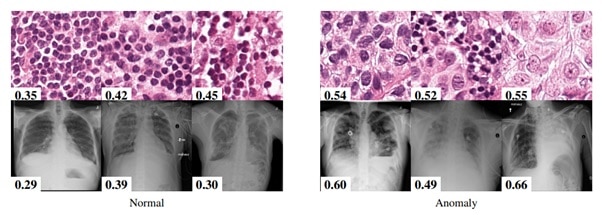
This is an example from the Camelyon 16 challenge (top) and the NIH dataset (bottom). Next to the image the anomaly prediction score by the proposed method. The higher score signifies an anomaly. It’s interesting to note that borderline cases are correctly evaluated by the model.
The network was also evaluated on two different natural image benchmarks: the CIFAR10 and SVHN. The official train-test split dataset was used, each of 10 classes, where one abnormal class was randomly on the train set, to use as a validation set with abnormal images.
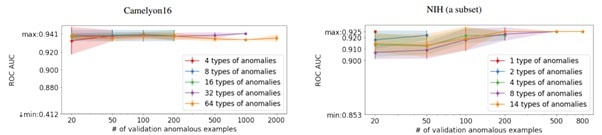
Here is shown the dependence of the quality of anomaly detection on the number of anomaly examples and their variability in the validation set.
Which was the evaluation metric used? Area Under the Curve of Receiver Operating Characteristic (ROC AUC) and the reason is that it integrates the classification performance (normal vs. abnormal) for all the different thresholds for the decision. That helps as there is no need to have a threshold for the predicted abnormality scores which allows to assess the performance of the models “probabilistically” and without a bias.
Some experiment specific settings are following! The SOTA baselines were chosen based on their efficiency on different paradigms: Deep GEO, Deep IF and PIAD. Additionally, for natural images AnoGAN, GANomaly, DAGMM, DSEBM and OCGAN methods. The Deep IF and PIAD approaches were implemented by using extensive descriptions provided by the authors. For GANomaly and Deep GEO the official code was used and the results of DAOL and OCGAN methods were obtained in the corresponding papers. Hyperparameter search was performed by maximizing average ROC AUC over 3 “folds”.
The Deep GEO approach has been used with great success on the SVHN dataset to distinguish individual digits (and from themselves), while the Deep IF approach shows the second-best result. There is showing that the experiment that even a small number of abnormal samples of one type of anomaly is enough to reject inferior hyperparameter configurations. In the two experiments considered, having 20 abnormal examples of the same type of abnormality proved sufficient to select the hyperparameters within the 2% margin of the optimal configuration.
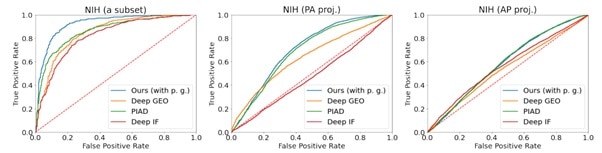
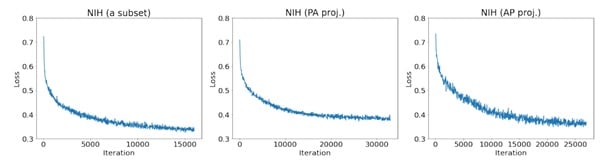
Here’s shown the training performance curves of the proposed method on a subset of the NIH, NIH (PA proj.), and NIH (AP proj.) datasets.
An ablation study shown on the Table 1 was used to signify the importance of the individual components proposed in the paper. The different scenarios are shown in the Fig. 5, where the use of perceptual loss outperforms the mere L1 norm (1) with a large margin. It is also important to note that the anomaly detection performance is affected by the method of selecting the hyperparameters as it reveals a subset of anomalies of confined variability. The proposed method excelled on the medical datasets but not as much for the nature image baselines of SOTA. One reason for that may be that the high diversity present in the natural data lead to overgeneralization of the autoencoder.
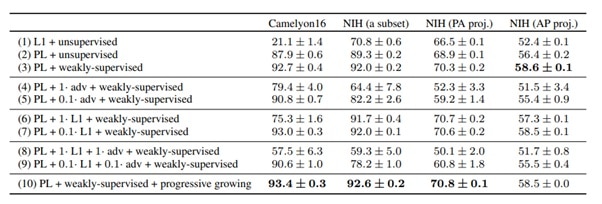
Ablation study with ROC AUC in percentage standard deviation.
Overall, a range of state-of-the-art image anomaly detection methods was explored and a proposed novel method using an autoencoder to understand the representation of the normal data was shown. This could influence a real-life clinical workflow, where generation of reproducible results by an efficient experiment design can be achieved.
Wrapping up!
I hope you enjoyed again this month’s article. Even though the topic was a little bit different than usual, being able to get inspiration and example from other subjects is more than worthy. Sometimes, similar problems have been solved in other disciplines in various ways, and it would be un worthwhile to ignore this!
Thank you, Nina, for providing access to the paper and the results. It’s great to discuss the latest on imaging techniques, especially ones that are valid in different domains 😊 Remember to always refer to the original article for more discussion, details, and the full references for all the material used!
Keep reading the Medical Imaging News section of our magazine.
Read about RSIP Vision’s R&D work on Medical Image analysis.