


 51 / 56

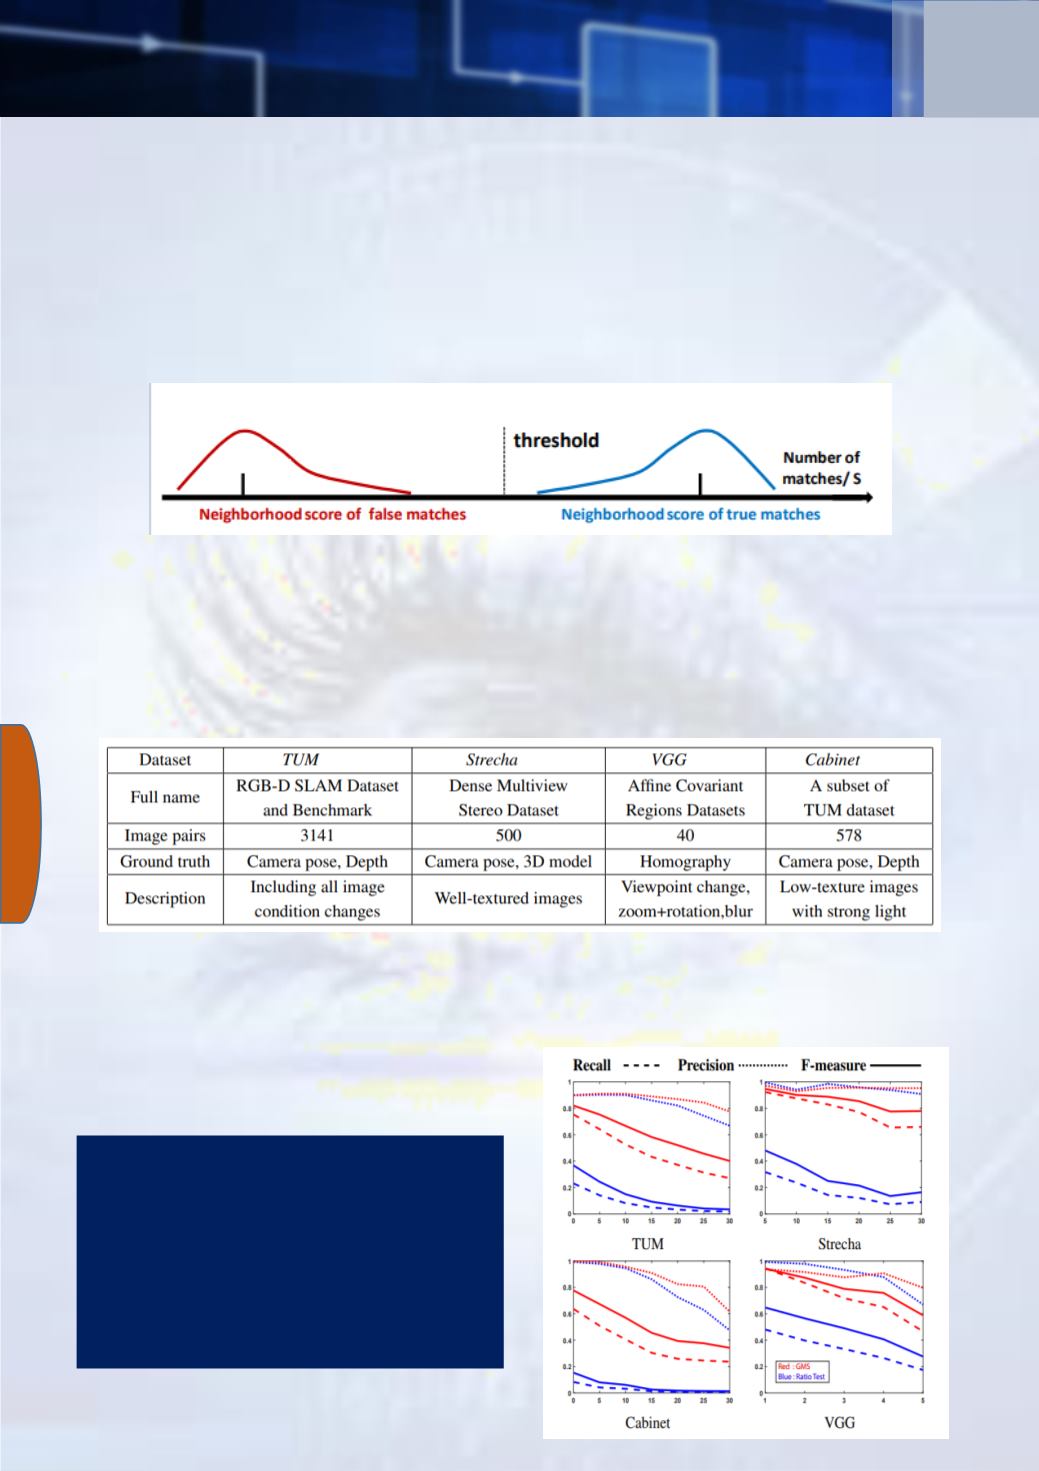
image (lines 4-10).
and are computed for the 9-cell neighborhood of the
cell with the highest number of matching features for the i-th iteration (line 11).
If the number of matching features exceeds the threshold, those features are
included in the result (
Inliers
).
The threshold condition eliminating false matches (line 12) is based on the
statistical model of the different distribution of supporting matches in the
surrounding region in the case of true and false matches.
Readers who want to read more about the model and the statistical assumptions
can find in depth details in section 2 of the article.
Evaluation and Results:
The paper used four datasets detailed in the table below:
Results are divided according to several metrics:
(1)
Precision and Recall:
Research
GMS was compared against
ratio-test (with a threshold of
0.66). Precision (dotted lines)
was very close, but in recall
and F-measure GMS clearly
outperformed
Computer Vision NewsResearch
51