


 50 / 56

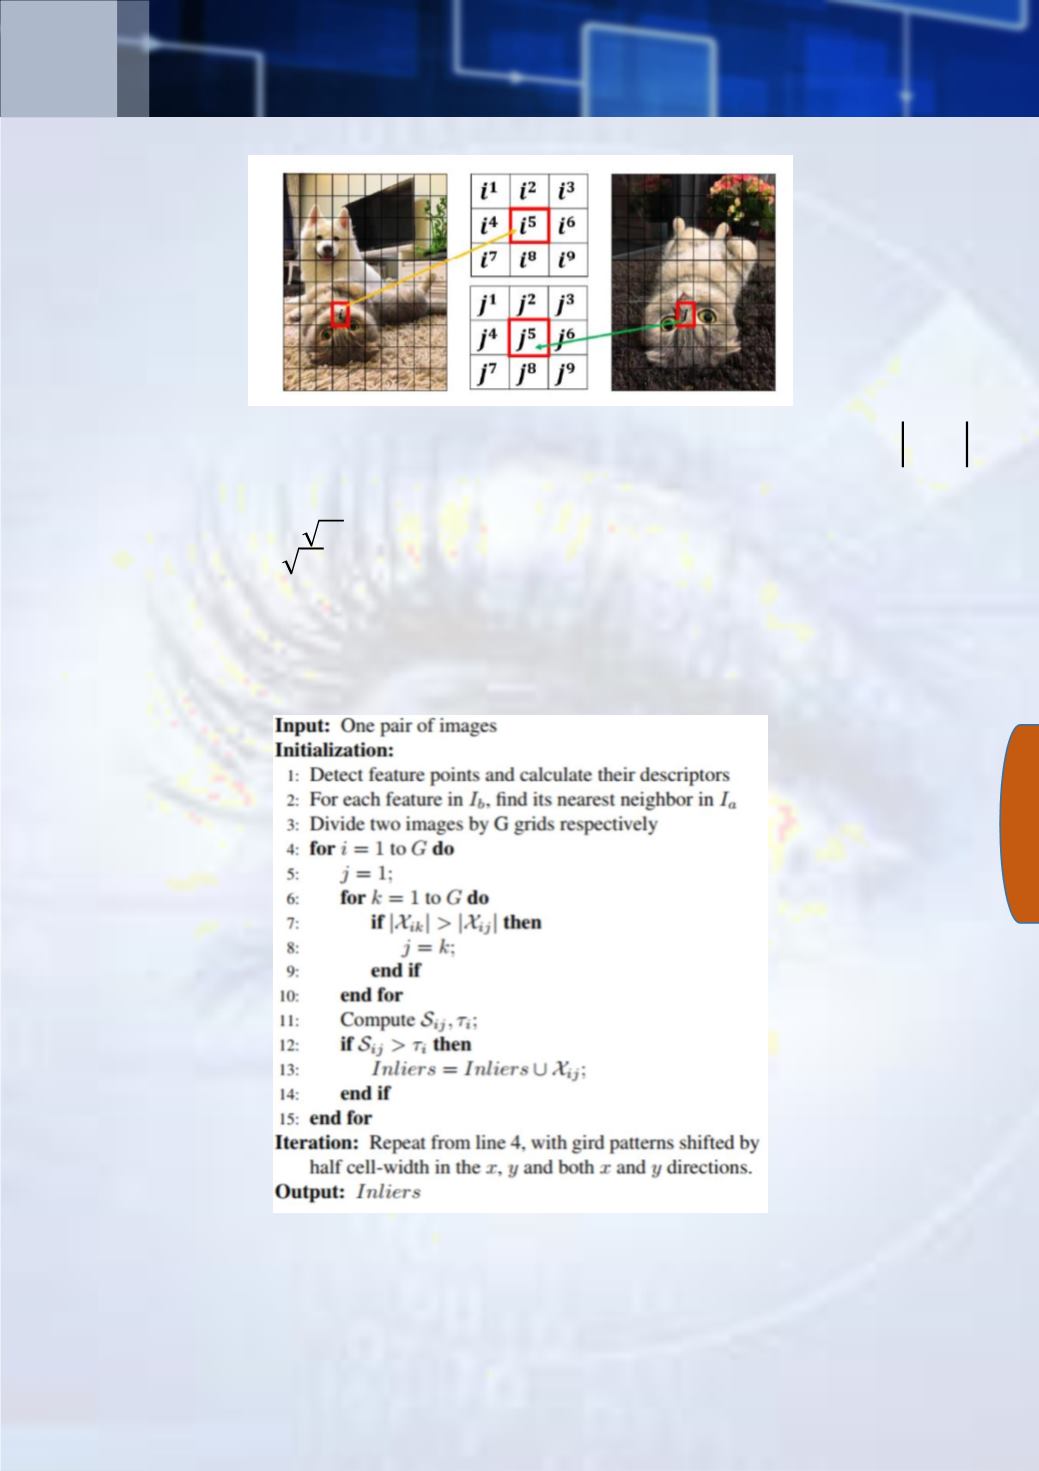
is the score for cell-pair
{ , }
. Defined by the equation
=
=1
9
.
(small s) denote the standard deviation of the binomial distribution of the
false matches. The threshold approximated as
⋅
, which can in turn be
approximated as
⋅
. This last approximation gives us a per-cell threshold,
defined as
= ⋅
, where
= 6
was empirically selected and is the total
number of features in the 9-cell neighborhood, as illustrated above.
Now we are equipped with all notation let’s dive into the algorithm. The
pseudocode is followed by explanations of the steps.
The input of the algorithm is a pair of images and the output is the matching
features denoted as
Inliers
.
The algorithm starts by detecting ORB features in both images and divided them
into G-cell grids (lines 1-3). Next, the algorithm loops over the cells in one image
and finds the cells with the highest number of matching features from the other
Research
50
Computer Vision NewsResearch