Animal Health Monitoring – Body Condition Scoring
For a long time, farmer’s objective was to get the highest milk production from their cows, while feeding them in the most efficient way. Veterinary research demonstrates that the amount of food a cow is eating is correlated to the milk it produces.
This animal health monitoring method is based on evaluating the back part of the cow. Specifically, measuring the amount of back fat. Fat cows, according to the research, eat more and have low milk production. On the other hand, a thin (slim) cow, as measured by its back, does not eat enough and its milk production is low. In the first case, the amount of fat cow’s food intake should be diminished. In the latter case, the food intake of the thin cow should be increased. Of course, there are cows within the normal fat range which keep getting the same amount of food. The normal cows are in the right range. They are most efficient, using their food mostly to produce milk.
RSIP Vision successfully implemented this veterinary concept into a working system.
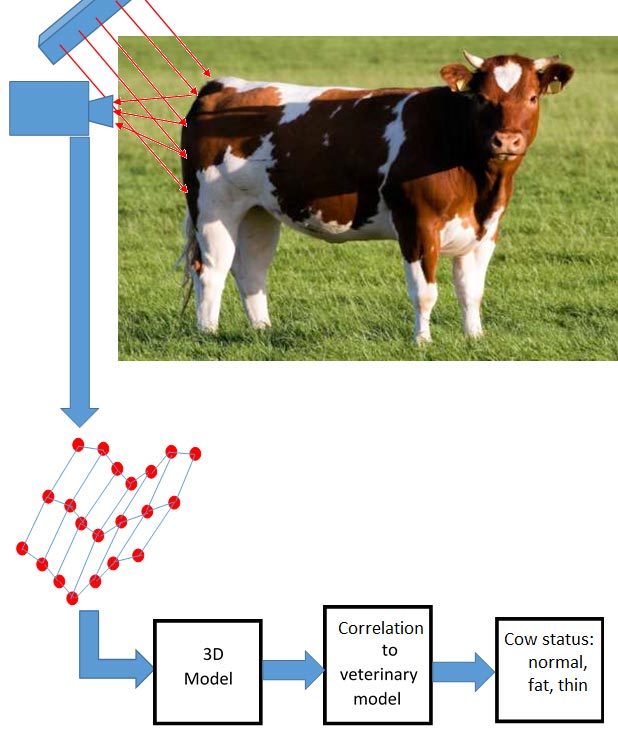
The system consisted in a laser scanner, with image processing and algorithmic software. The scanner provided details of the back of the cow shape. The software, first, constructs a 3D model of the cow’s back. The 3D model is analyzed, using the veterinary reference model, and the amount of cow’s fat is derived. As a result, each cow is provided with the right amount of food based on its fat. A closed loop system is actually formed, since the fat measurement is performed 3 times a day, just before the milking process. The detailed data and its generation rate enable the farmer very accurate follow-up of the process and of its cow’s performance.
The scanner was based on a laser guns line. A set of laser guns, forming a line of red laser targets was hinged from the cowshed roof. It drew a line of red markers on the cow’s back. Since the cow was moving slowly in the milking queue, the red targets where moving slowly, in the backward direction. A video camera captured the red targets, moving on the cow’s back at a frame rate of 25/30 frames per second.
We registered about 10 frames of red targets per cow. Each frame had 10 red markers. The markers showed the curviness of the back of the cow at successive cross sections. This data was used to form the 3D model.
Our software provides automatic Body Condition Scores that correlate with an expert’s diagnosis. The client can access information when he or she desires, without relying on a veterinarian’s availability or time. Regular access to the Body Condition Score enables the client to track changes in cows over a short period, ensuring more informed decisions about livestock treatment and feeding, saving our client time and money.